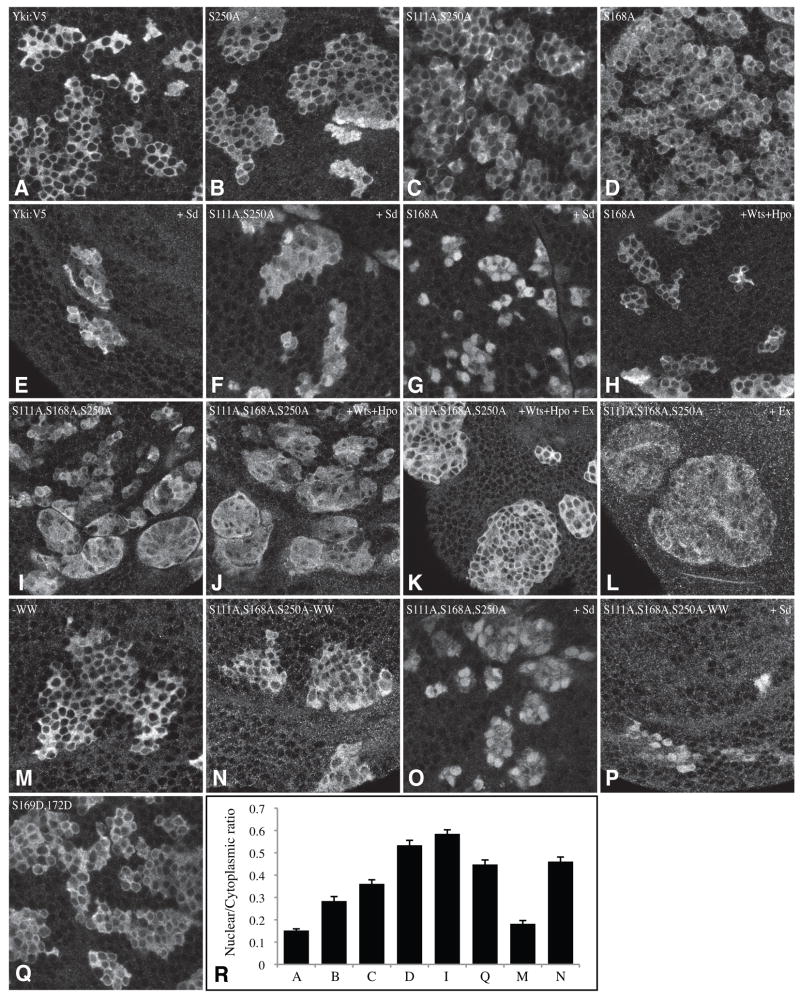
Figure 5. Nuclear localization of Yki:V5 isoforms in vivo.
Close-ups of wing imaginal discs with clones of cells expressing Yki:V5 isoforms under actin-Gal4 control, stained for Yki (white). Not all nuclei are in the same focal plane, thus in some cases staining appears uniform because the optical section is above or below the nucleus for that cell. A) UAS-yki:V5, (B) UAS-ykiS250A:V5, (C) UAS-ykiS111A S250A:V5, (D) UAS-ykiS168A:V5, (E) UAS-yki:V5; UAS-sd, (F) UAS-ykiS111A S250A:V5; UAS-sd (G) UAS-ykiS168A:V5; UAS-sd (H) UAS-ykiS168A:V5; UAS-hpo UAS-wts (I) UAS-ykiS111A S168A S250A:V5, (J) UAS-ykiS111A S168A S250A:V5; UAS-hpo UAS-wts, (K) UAS-ykiS111A S168A S250A:V5; UAS-hpo UAS-wts UAS-ex, (L) UAS-ykiS111A S168A S250A:V5; UAS-ex, (M) UAS-yki-WW:V5, (N) UAS-ykiS111A S168A S250A -WW:V5 (O) UAS-ykiS111A S168A S250A:V5; UAS-sd, (P) UAS-ykiS111A S168A S250A -WW:V5; UAS-sd, (Q) UAS-ykiS169D S172D:V5. (R) Histogram showing nuclear/cytoplasmic ratio of fluorescent intensity (anti-Yki) in clones of cells expressing different UAS-Yki:V5 transgenes; the letters correspond to the genotypes as indicated by the figure and legend. Values depict the average of 30 measurements; error bars indicate s.e.m.

