
Figure 7.
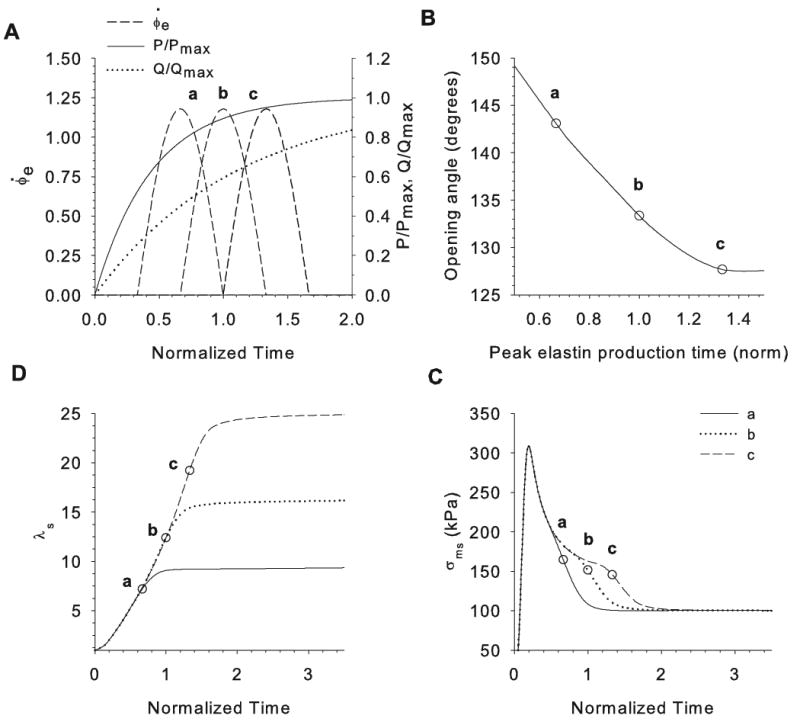
Effects of elastin production time on opening angles in cylinder model C2. (A) Pressure P, flow rate Q, and three example elastin production-rate curves (a, b, c) are plotted as functions of time during development. Time is normalized by the time of birth. (B) Opening angle plotted as a function of peak elastin production time. (C) Axial stretch ratio plotted as a function of time for cases a, b, and c. (D) Axial stress of smooth muscle at inner radius of artery plotted as a function of time for cases a, b, and c. Circles in B–D indicate the peak elastin production time for cases a, b, and c.