
Figure 2. Modulation of H3K4, H3K27 and H3R2 methylation by chromate.
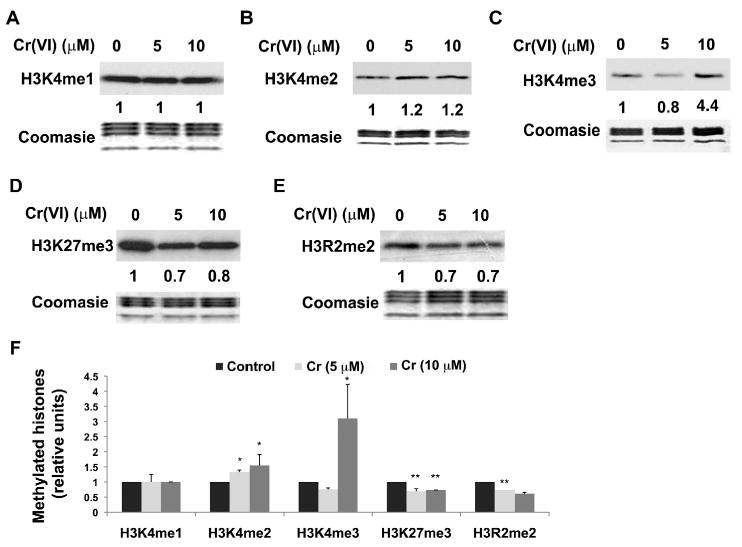
A549 cells were exposed to 5 or 10 μM Cr(VI) for 1 hour. The global levels of mono-(H3K4me1, A), di- (H3K4me2, B), tri- (H3K4me3, C) methylated H3K4, tri-methylated H3K27 (H3K27me3, D) and di-methylated H3R2 (H3R2me2, E) were measured using specific antibodies. The relative intensity of the bands was measured and the numbers were shown below the corresponding bands. The results from replicate experiments were plotted as the mean ± SE (error bars, n=3). Coomassie blue staining was used to assess the equal loading of the histones. Statistical significance of difference between control and chromium-treated cells was analyzed using Student's t-test. * P < 0.05, ** P < 0.01.