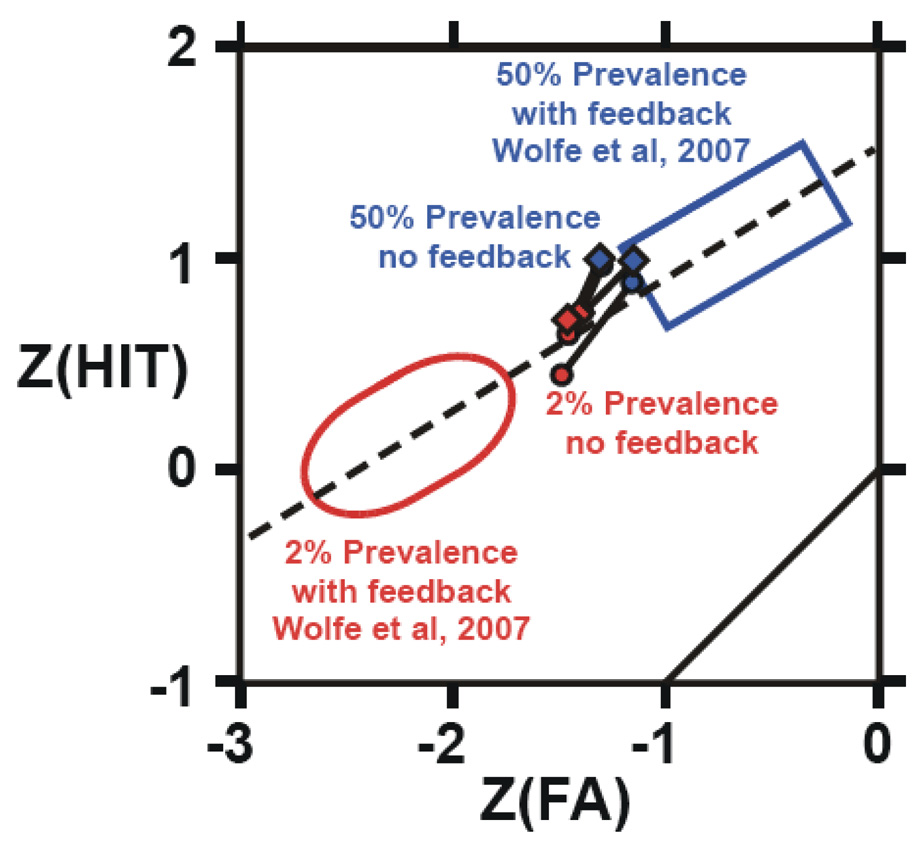
Figure 10.
Data from 2% and 50% prevalence experiments with feedback (from Wolfe et. al, 2007) and without feedback (present exps.). The figure shows that there is a greater shift in criterion with feedback than without. Dotted line represents an ROC of slope 0.6 in z-coordinates. Large open oval (red) shows the range of 2% prevalence data from Fig. 18 of Wolfe et al., (2007). Large open rectangle (blue) shows the 50% prevalence data from that paper. Data from Exps 1 & 2 of this paper are shown as ‘barbells’ lying between the open figures. In all cases, the end to the lower left (red) is 2% prevalence. Upper right (blue) is 50% prevalence. The steeper barbells are Exp. 1. Circles are before correction and diamonds, after.

