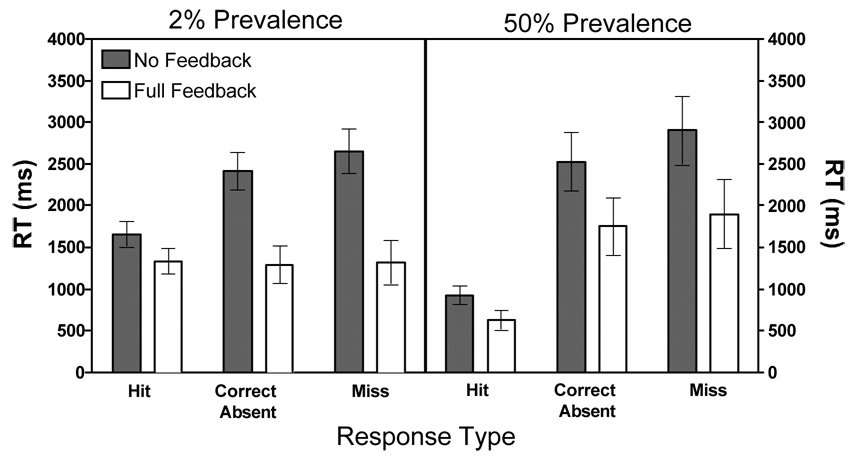
Figure 11.
RT in milliseconds for correct absent, hit, and miss responses. Full Feedback (Experiment 1a of Wolfe et. al, 2007) is represented in white bars and No Feedback (initial response data from Experiment 1a of the current paper) is in gray bars. Low prevalence is represented on the left panel and high prevalence on the right. Error bars represent between-subject 95% confidence intervals.

