Figure 1.
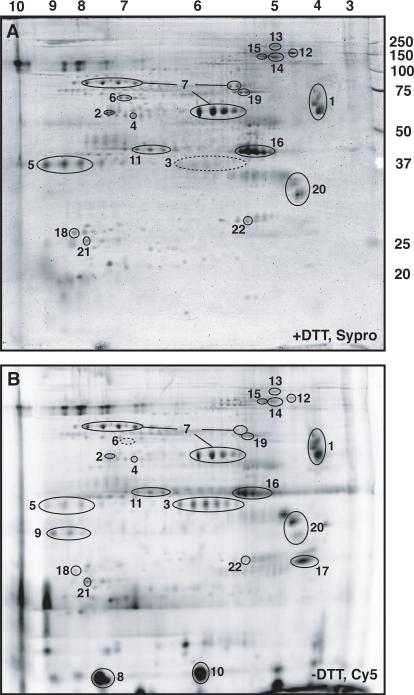
Two-dimensional gel electrophoresis of enriched eggshell preparations. Panels A and B represent Sypro Ruby staining and Cy5 fluorescent dye labeling, respectively, of a single gel on which was loaded 300 μg unlabeled proteins extracted in DTT-containing sample buffer and 60 μg proteins extracted in non-reducing sample buffer and labeled with Cy5. Thus, most of the protein spot intensity in panel A of this gel is derived from the DTT-extracted sample. Identified spots are numbered, and described in Table 1. Spot cluster 6 is only observed in DTT-extracted samples, while spot cluster 3 is weak or absent in these samples (indicated by dashed circles). Numbers above panel A indicate pI values in the isoelectric focusing dimension, while numbers at right indicate molecular masses (in kDa) of marker proteins in the SDS-PAGE dimension.

