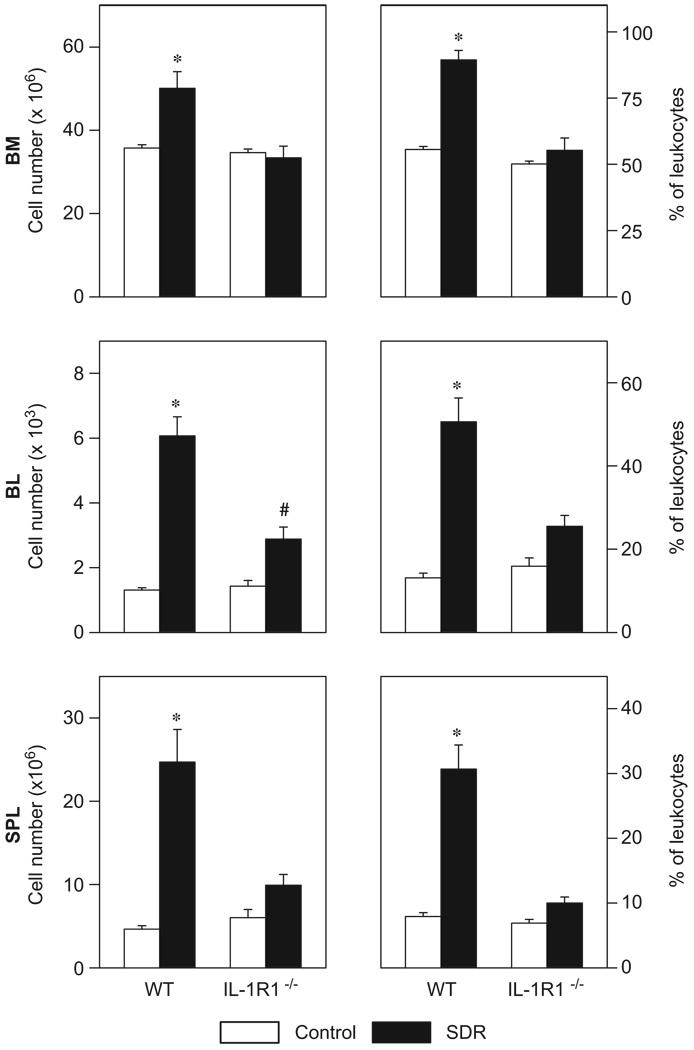
Figure 4.
Social stress differentially affected the distribution of CD11b+ cells in the bone marrow (BM), the blood (BL), and the spleen (SPL) of wildtype (WT) and IL-1 receptor type 1-deficient (IL-1R1−/−) mice. Absolute numbers (left) and percentages (right) of CD11b+ cells in control mice and in mice that were subjected to six cycles of social disruption (SDR) are shown. Two-factor ANOVA; *p<0.05 vs. all other groups, #p<0.05 vs. control groups; n = 6 per group.

