
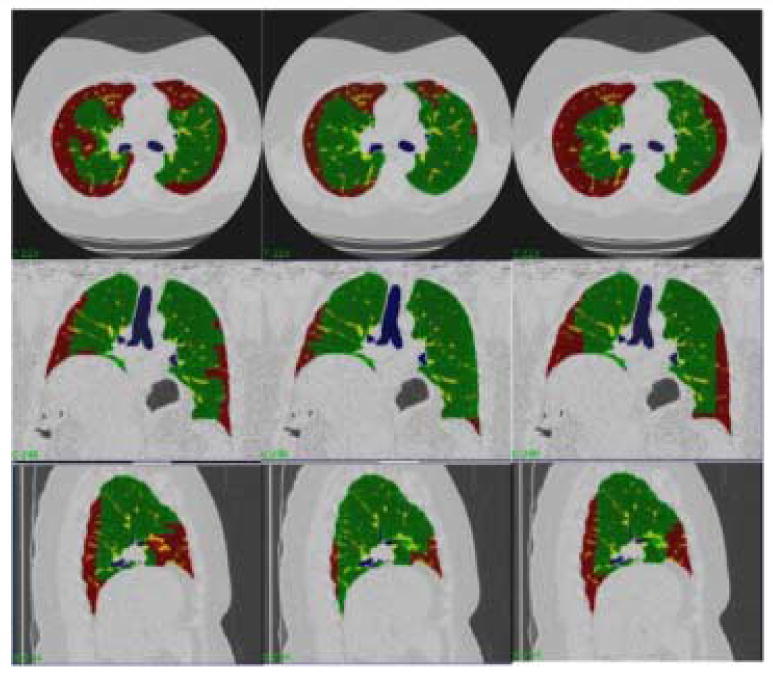
Fig. 7.
Each column is a segmentation of a dataset by a different expert. Each row is a different orientation (transverse, coronal, and sagittal). The colors represent different tissue classes: Green-Normal and Red-Reticular.
Official websites use .gov
A
.gov website belongs to an official
government organization in the United States.
Secure .gov websites use HTTPS
A lock (
) or https:// means you've safely
connected to the .gov website. Share sensitive
information only on official, secure websites.
Each column is a segmentation of a dataset by a different expert. Each row is a different orientation (transverse, coronal, and sagittal). The colors represent different tissue classes: Green-Normal and Red-Reticular.