
Figure 4.
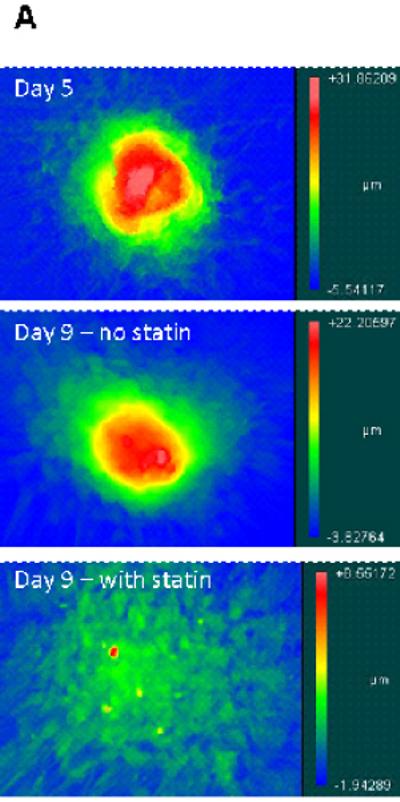
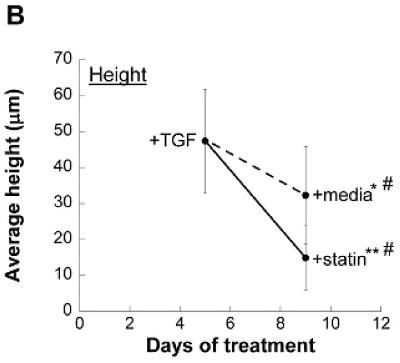
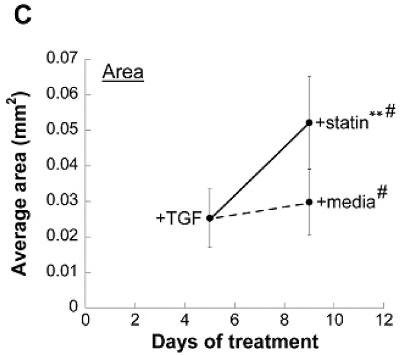
Nodules were induced via TGF-β1 treatment for 5 days and then switched to either plain medium or medium+simvastatin. (A) Representative topographical images of nodules at Days 5 and 9. (B) Average nodule height, and (C) Average nodule area at Days 5 and 9. * p < 0.03 vs. Day 5 condition, ** p < 0.0001 vs. Day 5 condition, # p < 0.0008 vs. Day 9 paired condition. n ≥ 16.