
Figure 3.
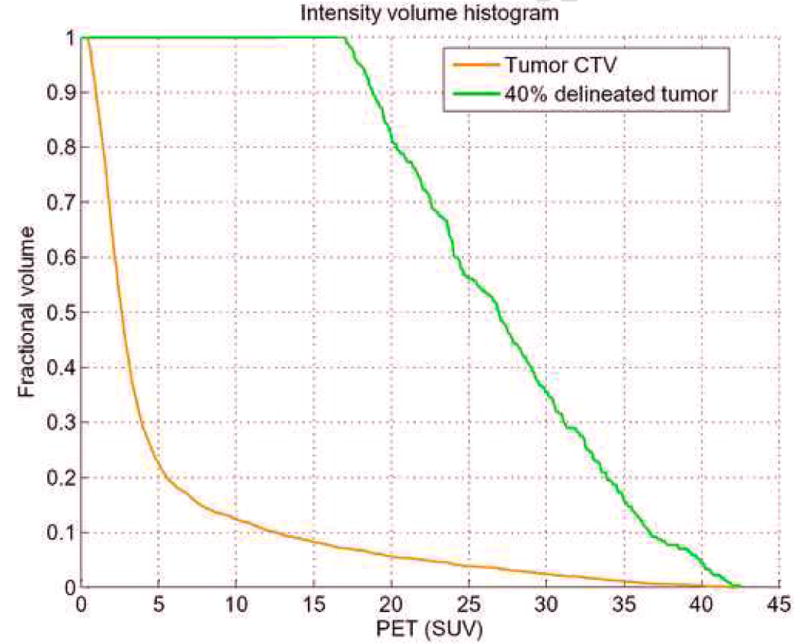
Intensity volume histogram (IVH) for cervix example showing the IVH plot for the clinical tumor region CTV (brown) and the 40% maximum SUV delineated tumor GTV (green). IVH-derived metrics such as Vx or Ix and their differentials could be extracted for outcome analysis.