
Figure 5.
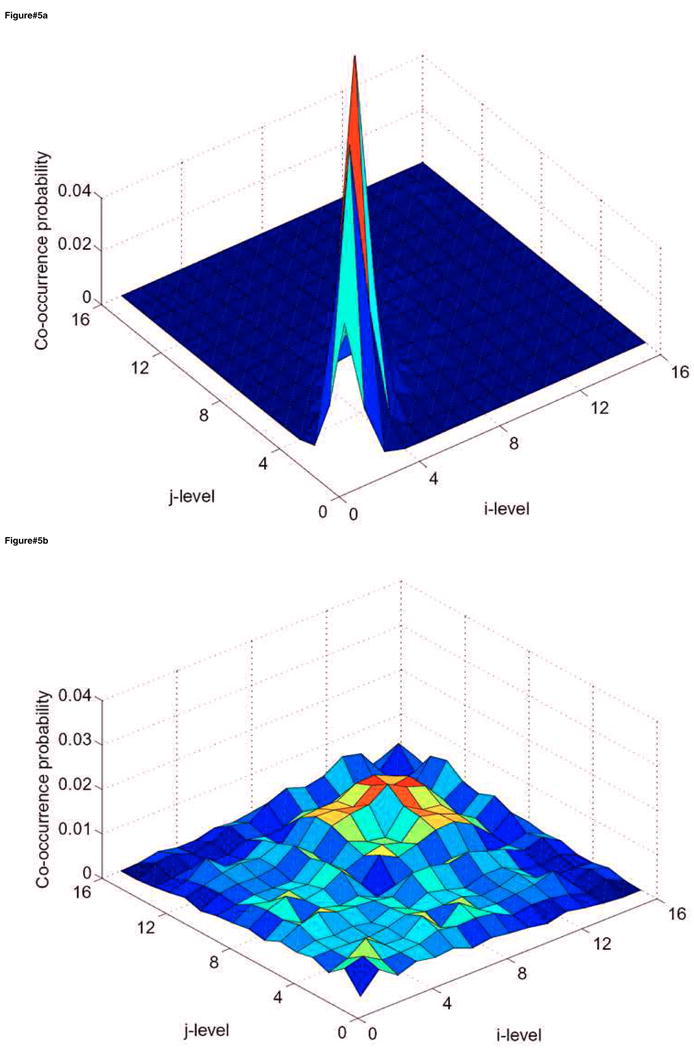
Surface plots of the co-occurrence matrix in the case of cervix cancer showing (a) the cervix tumor CTV and (b) 40% maximum SUV delineated tumor GTV. The texture pattern described by the co-occurrence matrix could be utilized to discriminate between homogeneous and heterogeneous tumors uptake. Note that the CTV is relatively smooth while the tumor is showing a ‘noisy’ texture pattern. The number of intensity levels (M) was selected to be 16 in this example.