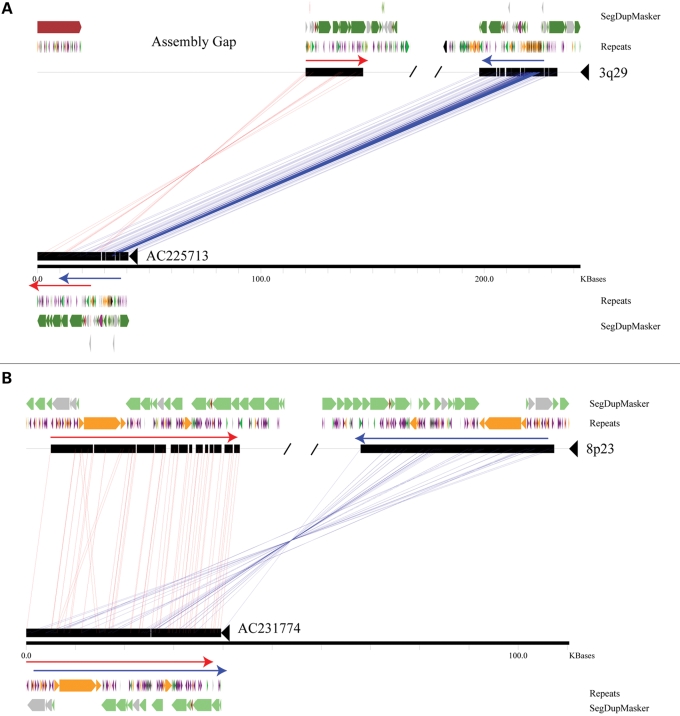
Figure 2.
Sequence resolution of inversion breakpoints. A miropeats comparison (49) between sequenced fosmids corresponding to the 3q29 (A) and 8p23 (B) inversions and the build35 reference are shown. For simplicity, only the regions around the breakpoints are depicted. Both inversion breakpoints map within highly identical stretches of duplicated sequence found in an inverted configuration (red and blue arrows), with the 3q29 inversion coincident with a gap in the reference assembly. Segmental duplications were predicted using DupMasker (45) and colored based upon the position of each ancestral duplicon. The locations of common repeats are also indicated: green: LINEs; purple: SINEs; orange: LTR elements; pink: DNA; gray/black: other/low complexity regions.

