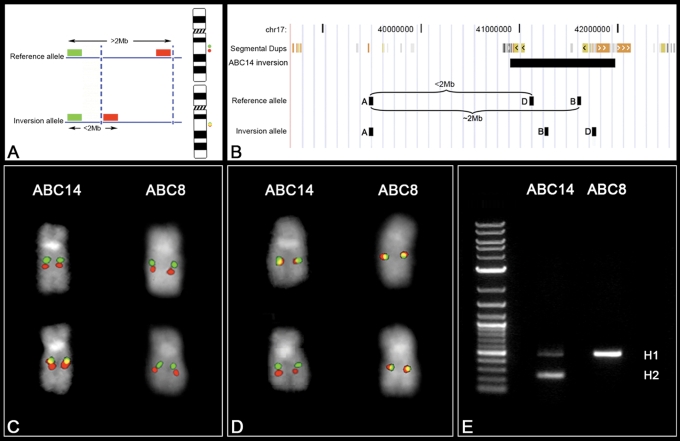
Figure 3.
FISH inversion assay. (A) A schematic showing human genomic probes labeled in green and red mapping >2 Mb apart in the non-inverted state that appears as two distinct signals on chromosomal metaphase spreads. In the inverted state, the two probes map less the 2 Mb apart and appear as a merged yellow signal. Dashed blue lines indicate the inversion breakpoints. (B) We applied the FISH assay to distinguish the orientation of the 17q21.31 region on metaphase chromosomes. Human genomic fosmid probes A and B map >2 Mb apart in the non-inverted state and appear as two distinct signals (red and green) on chromosomal metaphase spreads. In contrast, probes A and B map less the 2 Mb apart in the inverted state and appear as a merged (red+green = yellow) signal (C). A reciprocal assay on the same samples using probes A and D (non-inverted=yellow; inverted=red+green) confirm the specificity of the assay (D). An analysis of 27 HapMap cell lines using this assay showed 100% correspondence between the H1/H2 haplotype and the non-inverted/inverted status as determined by PCR (E) and SNP genotyping.

