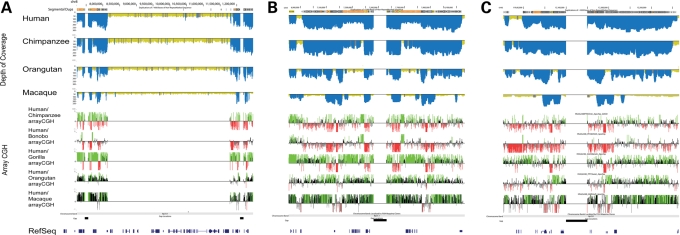
Figure 6.
(A) Comparative segmental duplication analysis of the 8p23 inversion region. The top panel shows the computationally predicted regions of segmental duplications [excess depth of coverage (blue) of aligned human, chimpanzee, orangutan and macaque WGS sequence to the human reference genome (build35)]. The lower panel shows the results of arrayCGH experiments for chimpanzee, bonobo, gorilla, orangutan and macaque using human as test. Enlargement of the distal and proximal breakpoints are shown in (B) and (C), respectively.

