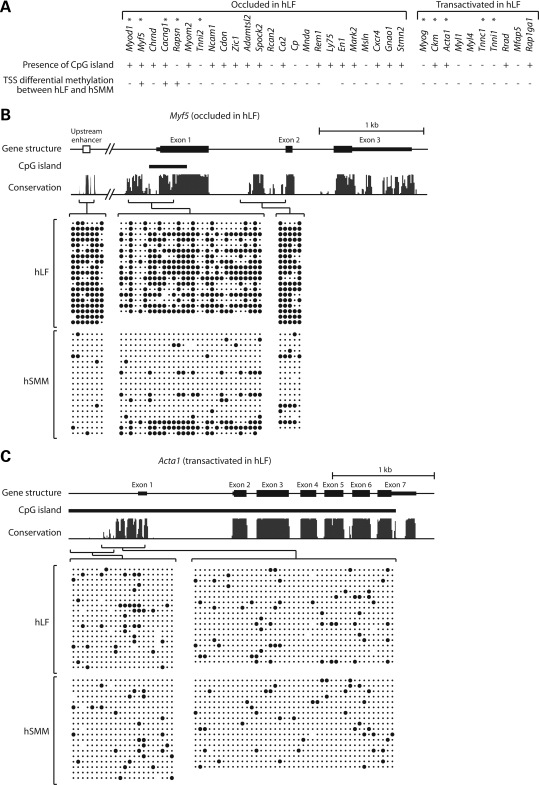
Figure 1.
Bisulfite sequencing analysis of DNA methylation. (A) The 25 occluded and 10 transactivated genes in hLF that we uncovered previously (2). The presence or absence of CpG island in each gene is indicated, along with whether transcription start site (TSS) is differentially methylated between hLF and hSMM. (B) DNA methylation pattern of the occluded gene Myf5. (C) DNA methylation pattern of the transactivated gene Acta1. In the schema of gene structure, exons are shown in solid bars with thick bars indicating coding regions and thin bars indicating untranslated regions. Bioinformatically identified CpG islands are indicated. In the conservation graph, the height of peaks reflects the degree of cross-species conservation. Individual amplicons in bisulfite sequencing and their corresponding genomic regions are indicated by brackets. Within each block of bisulfite sequencing data, columns correspond to CpG sites while rows correspond to sequenced clones. Solid circles indicate methylated CpG; dots indicate unmethylated CpG.

