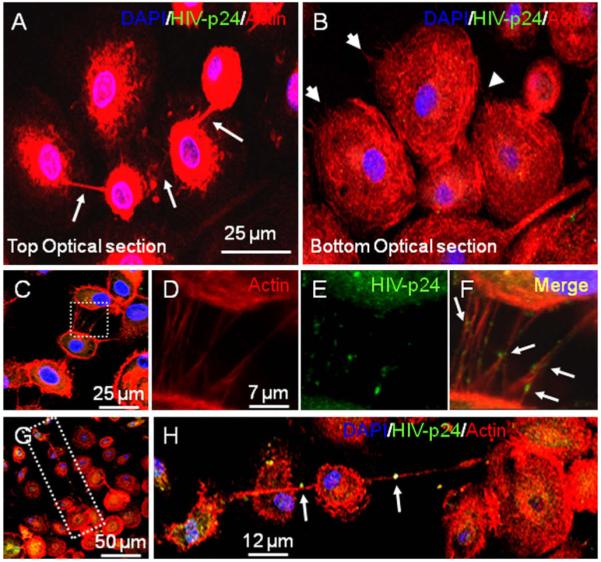
Fig. 5.

Distinct HIV vesicles localization in TNT processes. Staining of macrophages infected with HIV for HIV-p24 (green staining), actin (Texas Red-phalloidin, red staining) and DAPI (blue staining) and subsequent 3D reconstruction demonstrated that one cell can have both filopodia and TNT in different optical planes. It also demonstrated HIV particles between connected cells. (A and B) These pictures correspond to the same field showing that the same cell can have both TNT (top optical section) and filopodia (bottom optical section) (see arrows). Panel (C) represents a picture of short TNT in HIV-infected macrophages at day 3 post-infection stained for HIV-p24 (green staining), actin (Texas Red-phalloidin, red staining) and DAPI (blue staining). The white box in (C), enlarged in (D-F), corresponds to short range TNT, stained for actin (Texas Red-phalloidin, red staining, (D)), HIV-p24 (green staining, E), and DAPI (blue staining, no shown). Panel (F) corresponds to the merge of (D and E), showing HIV-p24 positive vesicles in short TNT (see arrows). The white box in (G), as enlarged in (H), corresponds to long range TNT, stained for actin (Texas Red-phalloidin, red staining), HIV-p24 (green staining), and DAPI (blue staining). Arrows denote HIV-p24 positive vesicles being transported across long range TNT.
