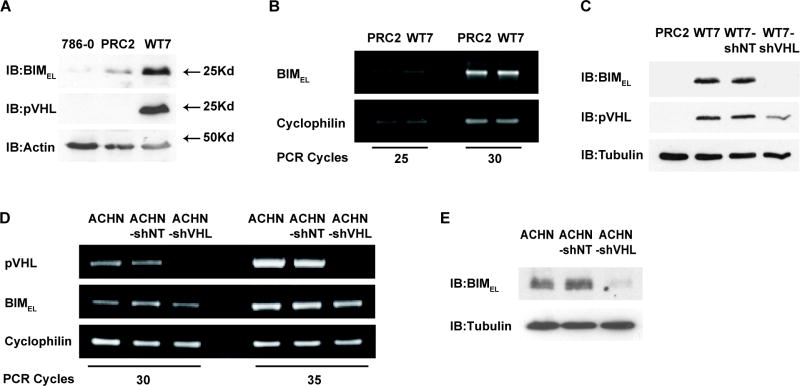
Figure 3. BIMEL protein levels in RCC cells correlates with expression of pVHL.
(A) Whole cell lysates from 786-0, PRC2, and WT7 cells were analyzed by immunoblotting with antibodies against BIM, pVHL and actin. Results shown are representative of blots from 4 independent experiments. (B) BIMEL mRNA expression in PRC2 and WT7 cells was analyzed by RT-PCR, starting with equal amounts of total RNA from each cell type. PCR products were compared after 25 and 30 cycles to avoid potential artifacts due to saturation of the PCR signal at high cycle number. Cyclophilin expression was analyzed to assess any variation in the amount of cDNA in each reaction. (C) Whole cell lysates from PRC2, WT7, WT7-shNT and WT7-shVHL cells were analyzed by immunoblotting for BIM, pVHL and tubulin. Results shown are representative of three independent experiments in which pVHL levels in WT7-shVHL cells are reduced an average of 50% (data not shown). (D) BIMEL and VHL expression in ACHN, ACHN-shNT, and ACHN-shVHL was analyzed by RT-PCR over 30 and 35 cycles of amplification. Cyclophilin expression was analyzed to assess potential variations in the amount of cDNA. (E) BIMEL protein levels in ACHN, ACHN-shNT, and ACHN-shVHL were analyzed by immunoblotting. Tubulin was immunoblotted as a control for protein loading. Results shown in B, D, and E are representative of results from 3 independent experiments.

