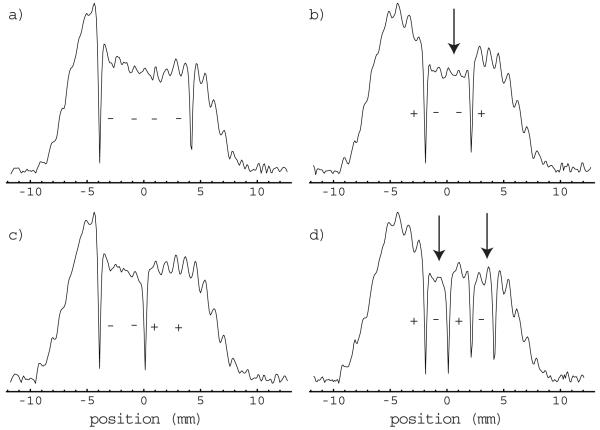
Figure 3.
The experimentally observed magnitude response profiles generated by the spatial encoding pulses described in Table 1 are depicted; - - - - (a), + - - + (b), - -++ (c) and + - +- (d). Selection bands having reduced signal intensity due to partial saturation effects are indicated by arrows.

