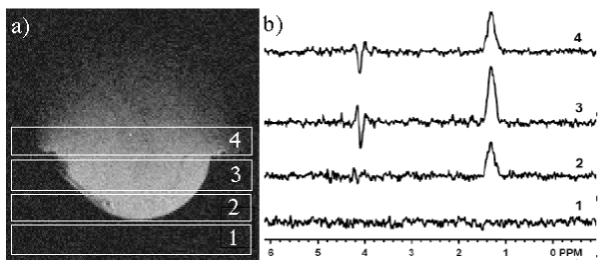
Figure 6.

Slice selective spectra were planned such that the first slice was in free space, the center two passed through the tumor, and the last slice was within the mouse body (a). Slice selective spectra show no signal in the first slice, and a maximum lactate intensity in the third slice (b).
