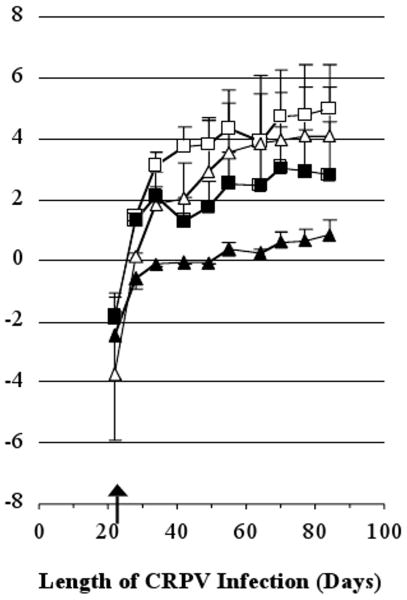
Fig. 2.
Papilloma growth in rabbits vaccinated after papilloma formation. Shown are the natural logarithms of the actual papilloma volumes in cubic millimeters (mean per site + SEM). Symbols used in this figure: (open symbols) the control group and (closed symbols) the vaccinated group. The shapes of the symbols represent sites infected with different dilutions of CRPV virus: 1:250 (squares) and either 1:1000 or 1:4000 (triangles). The arrow marks the day of vaccination.

