
Figure 6.
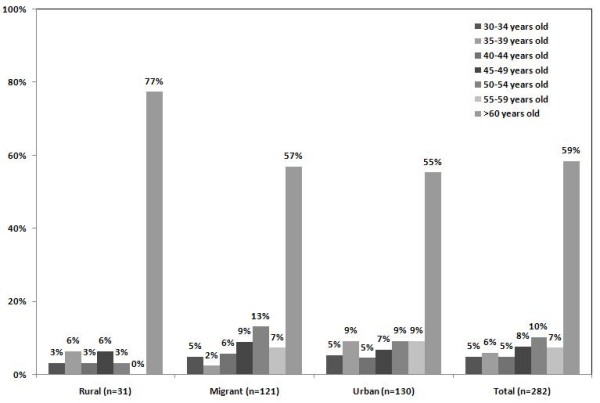
Distribution of refusals by age in each study group among the 282/323 non-responders who completed a rejection form.
Official websites use .gov
A
.gov website belongs to an official
government organization in the United States.
Secure .gov websites use HTTPS
A lock (
) or https:// means you've safely
connected to the .gov website. Share sensitive
information only on official, secure websites.
Distribution of refusals by age in each study group among the 282/323 non-responders who completed a rejection form.