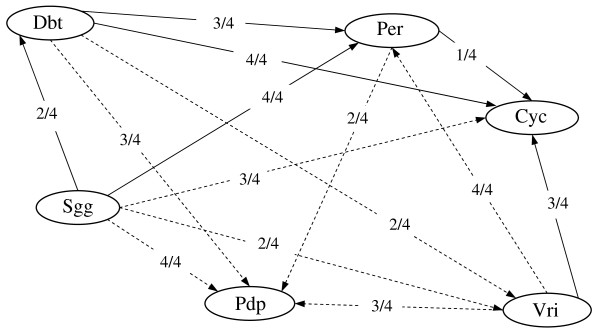
Figure 1.
Comparison of the predicted and expected relationships between genes pertaining to the circadian rhythm pathway based on four honey bee microarray sub-data sets. Solid arrows (edges) denote direct relationships predicted and confirmed in the fruit fly KEGG pathway. Dashed arrows represent indirect relationships predicted and confirmed in the fruit fly KEGG pathway. The number besides each edge denotes the fraction of sub-data sets that supported the edge. Genes: Per = Period clock; Cyc = Cycle; Vri = Vrille; Pdp = Pyruvate dehydrogenase phosphatase 1; Sgg = Shaggy; Dbt = double-time.

