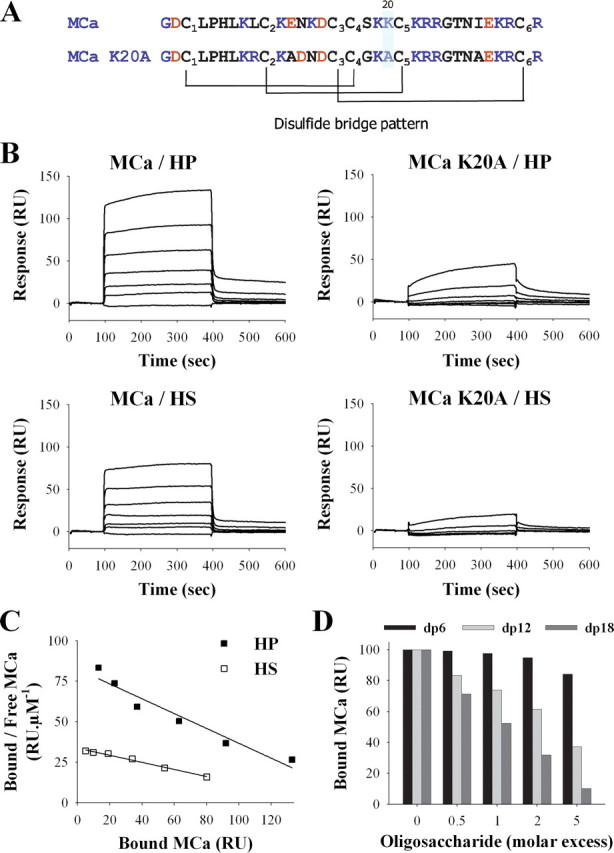
FIGURE 1.

Binding of wild-type MCa and MCa K20A to HP or HS immobilized on SPR sensorchip. A, primary structure of MCa and MCa K20A. Basic and acidic residues are in blue and red, respectively. The disulfide bridge patterns of both molecules are shown. B, sensorgrams of the interactions. Various concentrations of MCa or MCa K20A were injected over a HP- or HS-activated surface at a flow rate of 20 μl/min during 5 min. After this peptide injection time, running buffer was injected to monitor the wash off reaction. All responses were recorded and subtracted from the control surface online as a function of time (in RUs). Each set of sensorgrams was obtained with MCa at (from top to bottom) 5, 2.5, 1.25, 0.62, 0.31, 0.15, and 0 μm. C, Scatchard plots of the equilibrium binding data measured on the sensorgrams corresponding to the injection of MCa over HP or HS SPR surfaces. Data were fitted with a linear equation of the type y = a × x + b, where a =-0.46 (HP) or -0.22 (HS), and b = 82.5 (HP) or 33.7 (HS). Calculated binding affinities are Kd = 2.1 μm (HP) and Kd = 4.6 μm (HS). D, inhibition of the MCa/HP binding by HP-derived oligosaccharides. MCa (1 μm) was coincubated with increasing molar excess of dp6, dp12, or dp18 for 45 min, then injected over a HP-activated sensorchip for 5 min. Responses (in RU) were recorded and plotted as the percentage of maximum responses obtained without preincubation (70-80 RU).
