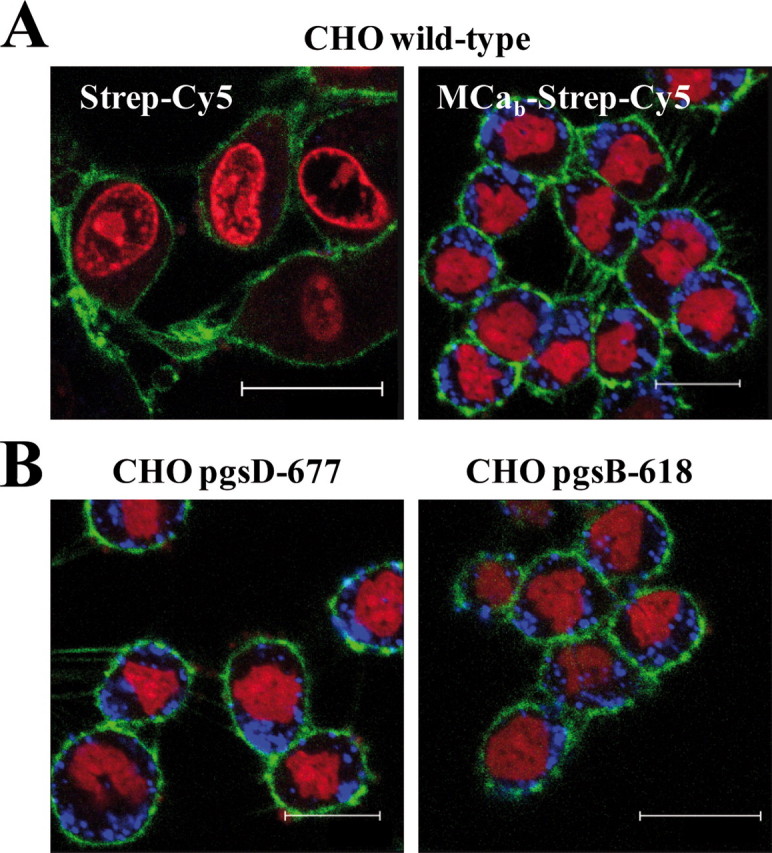
FIGURE 5.

Cell distribution of MCab-Strep-Cy5 in living wild-type or mutant CHO cells. A, confocal images showing the cell penetration of Strep-Cy5 (2 h of incubation) in the absence (left panel) or presence (right panel) of MCab (4 μm) in wild-type CHO cells. Scale bars, 25 μm (left) and 15 μm (right bar). B, cell distribution of MCab-Strep-Cy5 in mutant CHO cells. Scale bars, 15 μm (left) and 20 μm (right bar). Blue, Strep-Cy5; red, dihydroethidium, nuclei; green, concanavalin A, plasma membrane.
