
Figure 3. Effect of CB-loaded NP dose on gliosarcoma cell tagging.
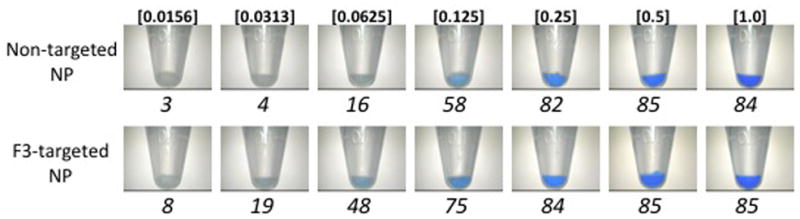
3A) Images of washed, pelleted 9L gliosarcoma cells after 15 min incubation with increasing doses (shown in italics; mg NP/mL) of non-targeted (top) and F3-targeted (bottom) NPs. Note difference in threshold of blue color visualization in non-targeted and F3-targeted NP-treated cells. Untreated controls (not shown) appear similar to samples treated with 0.0156 mg NP/mL. Corresponding quantified saturation of each cell pellet shown below each sample.
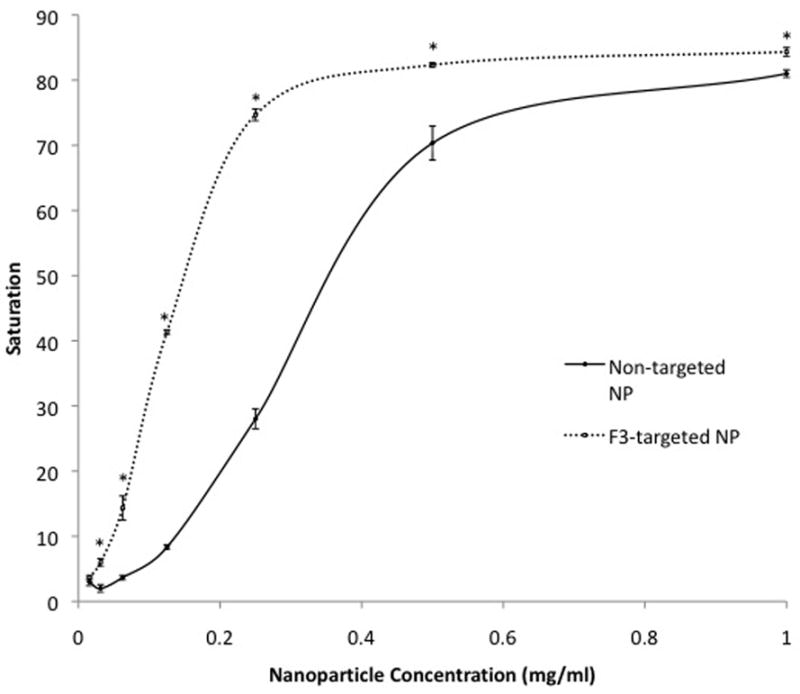
3B) Quantification of blue color saturation in NP-treated cells shown in 3a. Significant differences (P < 0.01) between samples at individual doses are indicated by an asterisk (*). Error bars indicate standard error of mean. Saturation values are absolute values and therefore do not have units.