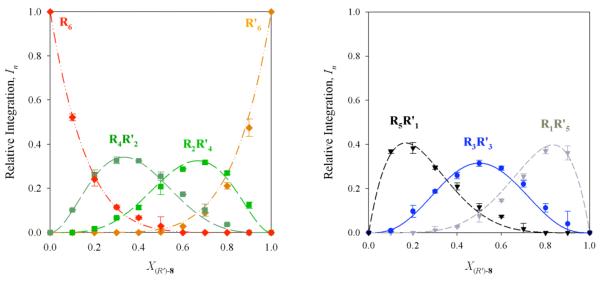
Figure 7.
Job plot showing the relative integrations (In)28 of RnR’6-n hexamers of enolates 5 and 8 as a function of the mole fraction of the R enantiomer of enolate analogous curves anticipated from a purely statistical distribution shows a striking similarity (Figure 8). 8 (X(R)-8). The curves correspond to parametric fits as described. Samples were 0.10 M total enolate in 3.0 M THF/toluene, and spectra were recorded at -40 °C.

