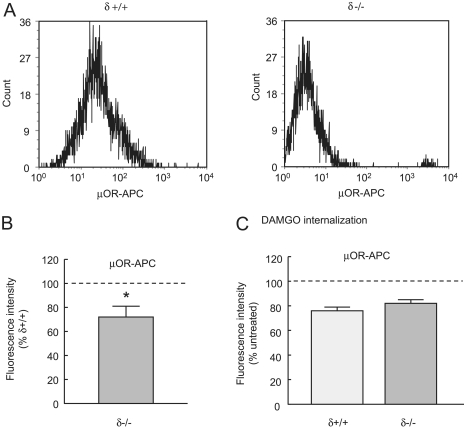
Fig. 4.
Cell surface μ-receptor levels are decreased in δ(-/-) neurons. A, exemplar histograms showing the distribution and numbers of δ(+/+) (left) and δ(-/-) cells (right) labeled with an antibody against the third extracellular loop of the μ receptor. The secondary antibody was conjugated to APC (see Materials and Methods). The population of cells is a subset of the total population, identified as neurons by their size and granularity. B, the graph illustrates the relative cell surface levels of the μ receptors in δ(-/-) compared with δ(+/+) DRG neurons (n = 6). There was significantly less surface labeling with the μ receptor antibody in δ(-/-) neurons, *, p < 0.05 determined by the Student's t test. C, the graph illustrates the loss of cell surface receptors caused by exposure to DAMGO (1 μM for 10 min). Average data (n = 3) are expressed as a percentage of μ-receptor labeling without exposure to DAMGO. There were similar levels of μ-receptor internalization in δ(+/+) and δ(-/-) neurons. In B and C, vertical lines represent ± S.E.M.

