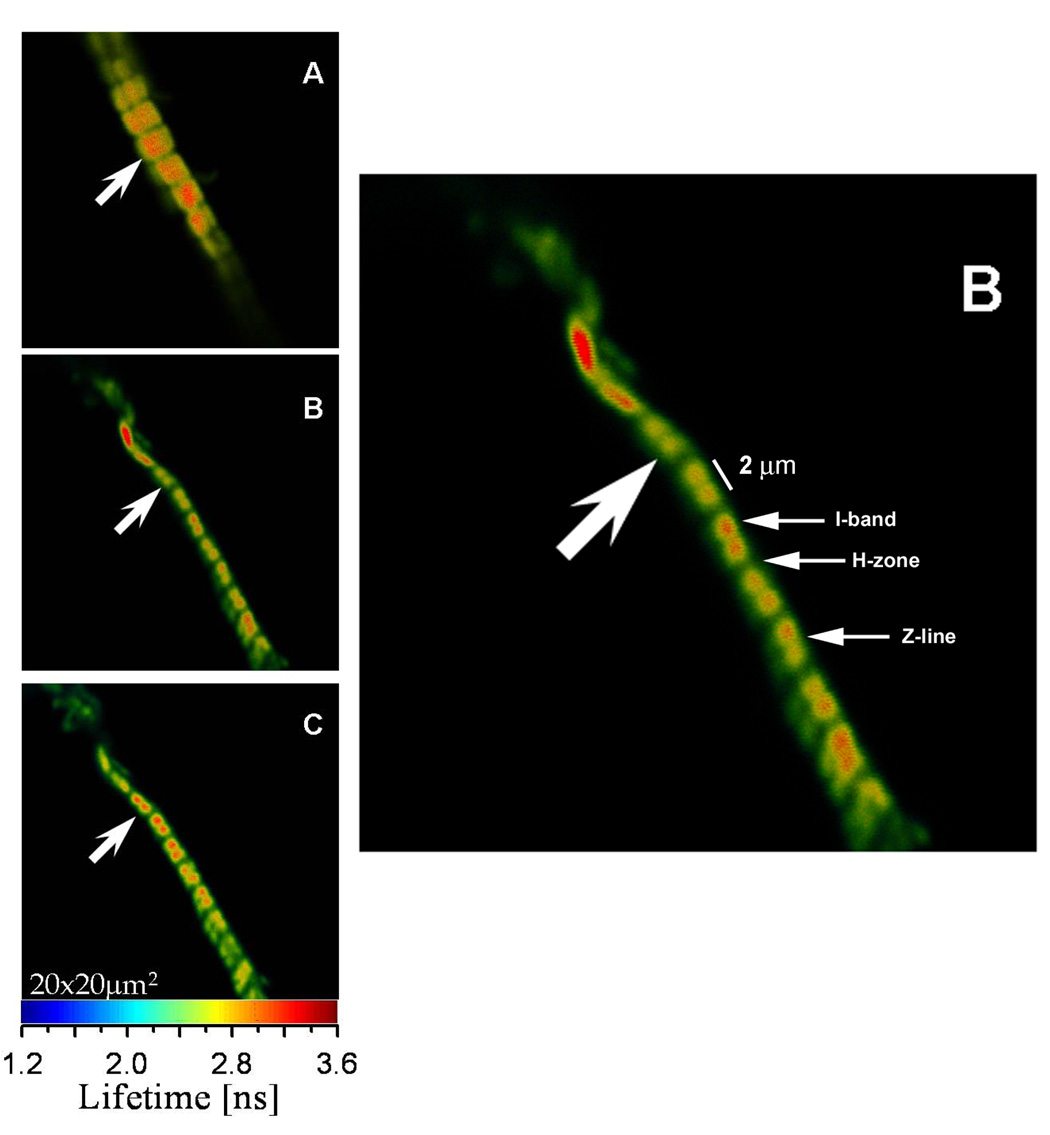
Fig. 1.
Lifetime images of rigor (A), relaxed (B) and contracted (C) Tg-WT myofibrils of cardiac papillary muscle. The color bar at the bottom is the lifetime scale. The enlarged image of a relaxed myofibril is shown on the right. Myofibrils were cross-linked to avoid shortening. Excitation was at 470 nm, emission was viewed through a 500 nm long-pass filter.

