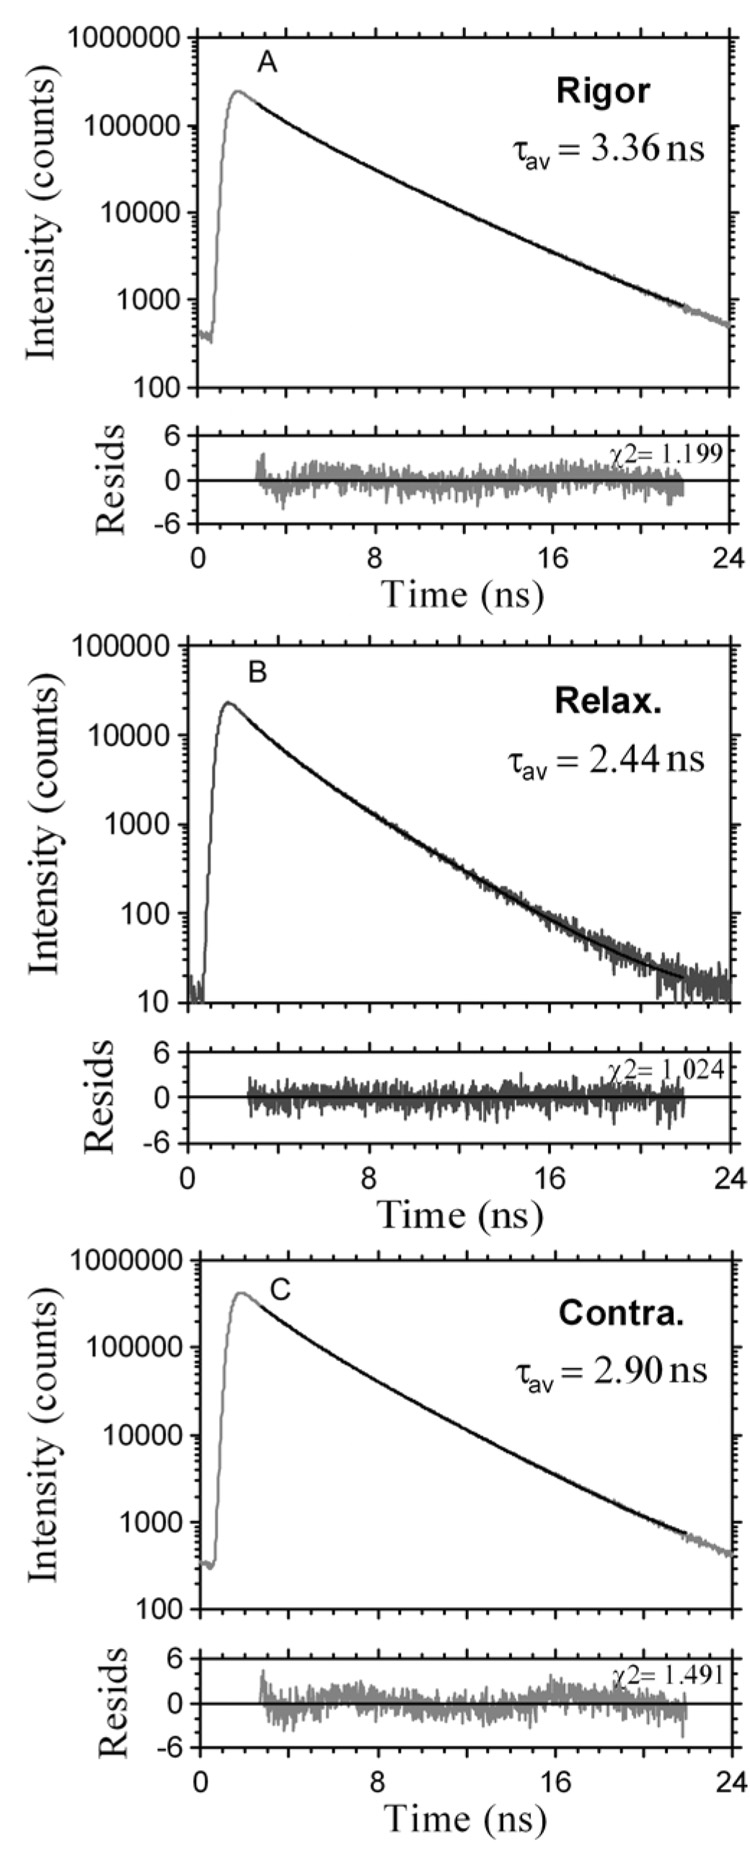
Fig. 2.
Intensity decays of fluorescence of pixels in the center half of the I-band pointed to by the arrows in Fig. 1. Black lines – data fitted by two exponentials. Bottom panels: residuals. Data collected for 60 sec, excitation with a 470 nm pulse of light, emission through LP500 filter.

