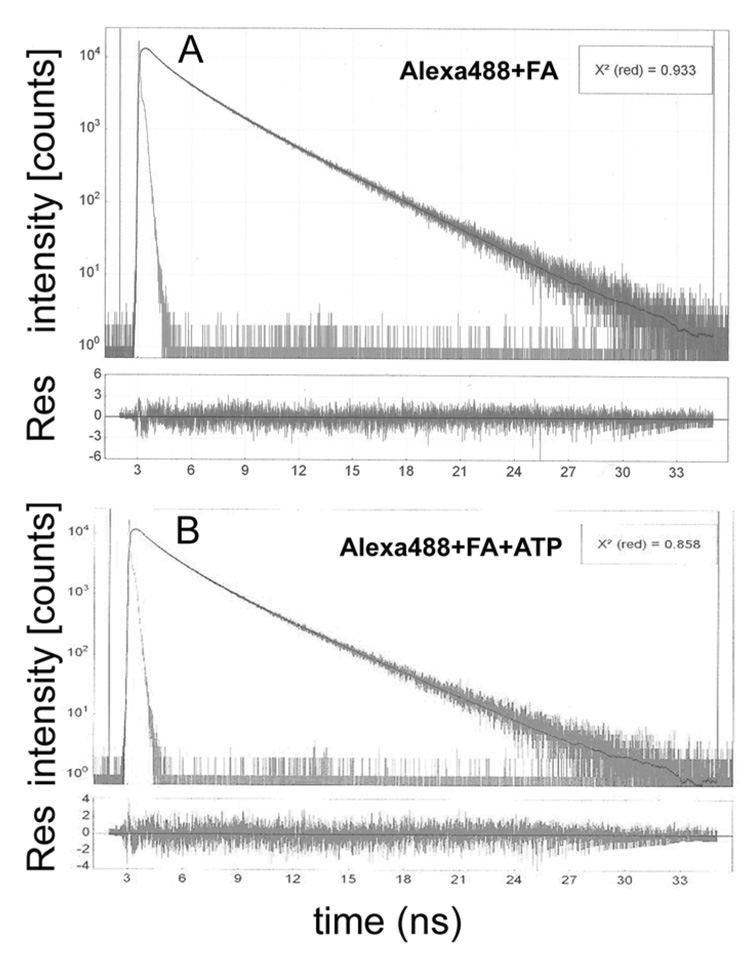
Fig. 5.
A – (top panel): The decay of fluorescence intensity following pulse excitation of F-actin (FA) labeled with Alexa488. B – (top panel): The decay of fluorescence intensity following pulse excitation of F-actin (FA) labeled with Alexa488 in the presence of 2 mM ATP‥ The residuals (RES) of the best two-exponent fit (black line) are shown in the bottom panels. The goodness of fit is characterized by the small value of χ2. Excitation at 470 nm, emission at 510 nm. 1 µM F-actin + 100 nM Alexa488-phalloidin in rigor buffer (A) and in rigor buffer + 2 mM ATP (B).

