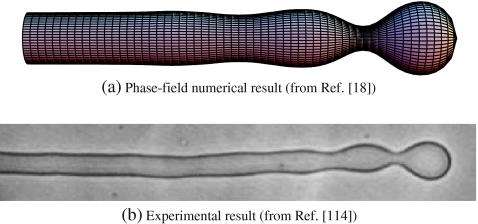
Fig. 3.
Onset of the pearling instability. Comparison of the phase-field numerical result from [18] (a) and the experimental result from [114] (b). Such a situation corresponds to a relatively small concentration of anchoring molecules globally applied to the tubular liposome. In the numerical results, there is no fitting parameter in the numerical integration and the spontaneous curvature is taken to be homogeneous and equal to  , below the pearling instability limit

