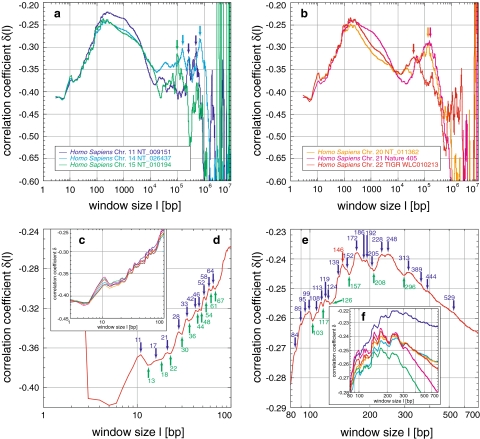
Fig. 2.
Correlations in Homo sapiens and their fine-structural features: the correlation coefficient δ(l) shows strong positive correlations for human chromosomes (a, b). In general, δ increases from a starting value until a plateaued maximum, before a decrease and a second statistically significant maximum for chromosomes XX, XXI, and XXII. Finally, δ decreases to values characteristic for random sequences and enters the region of fluctuation. Within this general behaviour, a distinct fine-structure is visible in all chromosomes (c, f), which survives averaging (d, e; Figs. 6, 9). The very pronounced local maximum at 11 bp might be related to the double-helical pitch, whereas the local minima and maxima are related to the nucleosome, which is obvious for 146 bp, but less obvious for 172, 205, 228, and 248 bp (d, e). The second maximum around 105 might be related to chromatin loops of the three-dimensional genome organization

