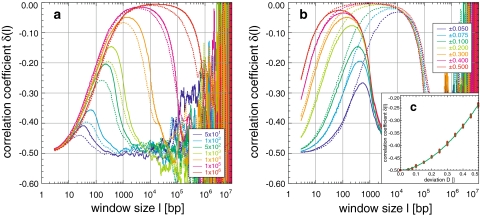
Fig. 7.
Appearance and simulation of the block structure of genomes: simulation of random sequences using blocks of random length B either from the intervals B ± 10% or 0 to B, and with deviations from the uniform purine/pyrimidine concentration, leads to a global maximum in the correlation coefficient (a, b). Its position, height, and descent are proportional to the block length (a; B ± 10%: solid line, 0−B: dotted line, B: see legend, for a deviation of 0.100) and the ascent to the maximum and its height are proportional to whereas its position is inversely proportional to the concentration deviation (b; B ± 10% with B = 103, solid line, B = 105: dotted line, deviation see legend). The descent is remarkably smooth, although fluctuations increase exponentially as a function of the window size l (Fig. 1). The degree of correlation follows a quadratic dependence δ(l = 3, D) = −0.5 + 0.113D + 0.855D2 with R = 0.99 (c), in contrast to the linear dependence found for simulations of the codon usage

