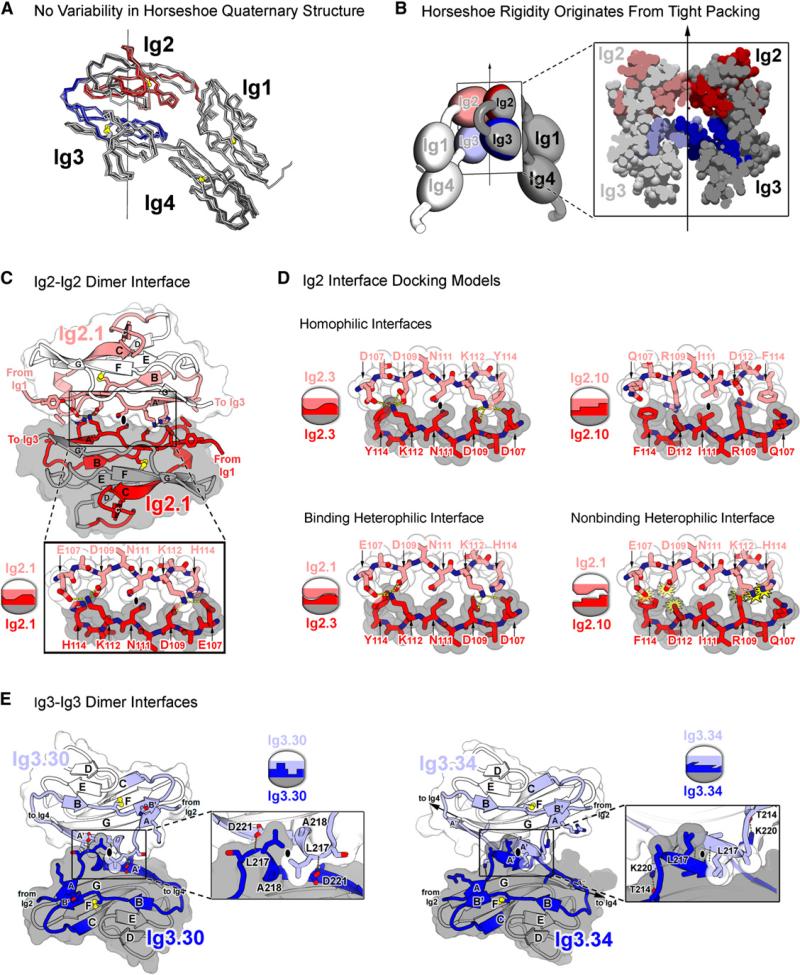
Figure 4. Ig2 and Ig3 Self-Binding Variable Domains Form a Composite Interface.
(A) Superimposition of horseshoe domains from eight different Dscam structures reveals lack of variability in domain-domain interactions, suggesting conformational rigidity in Ig1–Ig4. Structures superimposed (listed from dark to light) are the following: Dscam1−8, molecules A, B, and C; Dscam1−4 (1.34) chains A and B (PDB ID 2V5M and 2V5R); and Dscam1−4 (9.9) chains A and B (PDB ID 2V5S). RMS deviations in αCs are under 1.3 Å for all pairwise comparisons. Red and blue colors represent variable regions of Ig2 and Ig3, respectively.
(B) Rigidity of Ig1–Ig4 horseshoe originates from tight intramolecular packing of Ig2 and Ig3 within each molecule as illustrated via cross-section of the Ig1–Ig4 dimer. Light and dark shading distinguishes molecules in the dimer.
(C) Structure of Ig2.1-Ig2.1 interface in Dscam1−8 dimer. The Ig2-Ig2 interface is viewed down the two-fold symmetry axis. Molecule A is in lighter colors. The Ig2.1-Ig2.1 interface is two-fold symmetric and formed between identical segments along the A and A′ strands (residues 107−114). Opposing N111 residues pack against one another at the symmetry axis (black oval). Left and right networks flank the symmetry axis. K112 forms hydrogen bonds (H bonds) with E107 and D109. D109 additionally forms H bonds with H114. Intermolecular H bonds are drawn with yellow dashed lines. The Ig2.1 interface was previously described (Meijers et al., 2007).
(D) Ig2 interface docking models. Binding properties based on previous binding studies (Wojtowicz et al., 2007). Coloring is as in (A). Schematics illustrate presence or absence of electrostatic and shape complementarity at interface. Top: Ig2.3-Ig2.3 and the Ig2.10-Ig2.10 homophilic interfaces are shown. Opposing N111 and I111 residues, respectively, pack against one another at the symmetry axis (black oval). Flanking left and right networks comprise unique networks that exhibit electrostatic and shape complementarity. Bottom left: Ig2.1-Ig2.3 binding heterophilic interface is shown. These isoforms engage in heterophilic binding, albeit at levels lower than the homophilic binding of each. Lower levels of binding may be attributed to the left network, which is bulkier than its wild-type counterpart (D107-Y114 versus E107-H114), and may introduce steric constraint and to the right network, which is less bulky than its wild-type counterpart (D107-H114 versus D107-Y114) and may destabilize the H bonds. Bottom right: Ig2.1-Ig2.10 nonbinding heterophilic interface is shown. Electrostatic and shape noncomplementarity (yellow starbursts) are observed at the left and right networks. The left network contains three negatively charged residues (E107, D109, and D112). The right network contains steric clash between positively charged residues (K112 and R109).
(E) Structure of Ig3-Ig3 interfaces in Dscam1−8 and Dscam1−4 (1.34) dimers. View of Ig3-Ig3 interface down the two-fold symmetry axis (black ovals) is shown. Ig3.30-Ig3.30 (left) and Ig3.34-Ig3.34 (right; [Meijers et al., 2007]) dimer interfaces are shown. Molecule A is in lighter colors. Interface is formed between the identical transition segment between the A and A′ strands in opposing domains. In Ig3.34, this region forms a single turn of a helix; in Ig3.30, it forms a β strand. Both interfaces exhibit electrostatic and shape complementarity. Given the differences in structure, it is not surprising that these domains do not bind to each other (Wojtowicz et al., 2007).

