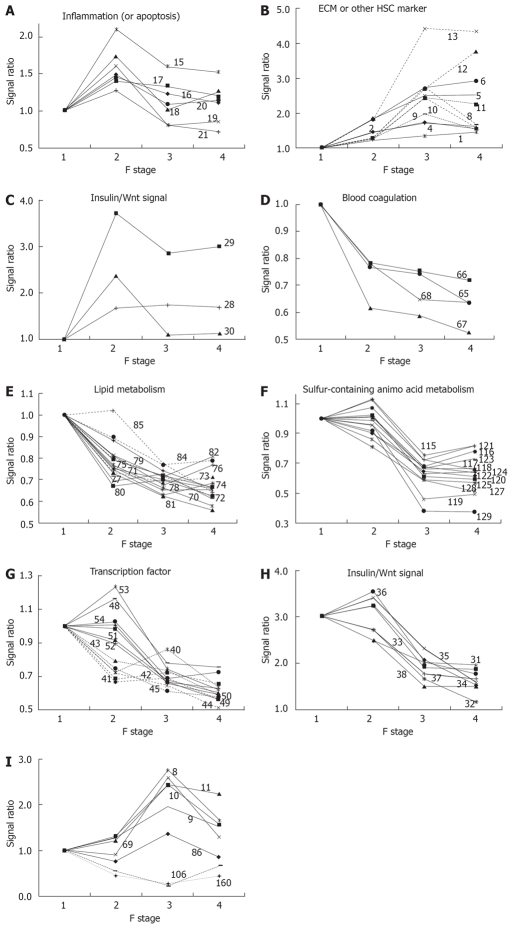
Figure 1.
Clusters of genes in functional categories. The characteristic behavior of gene clusters for each functional category is shown separately in Figure 1A-I. The numbers in each figure refer to the serial number of genes in Table 1. The expression ratio relative to the F1 stage is plotted in each graph. A: Inflammation gene cluster with a peak at F2; B: ECM gene cluster showing increased expression along with fibrosis progression; C: Insulin/Wnt signaling gene cluster with increased expression in the early phase of fibrosis; D: Blood coagulation factor gene cluster showing decreased expression along with fibrosis progression; E: Lipid metabolism gene cluster showing decreased expression along with fibrosis progression; F: Sulfurcontaining amino acid metabolism gene cluster showing a synchronous decrease in expression from F2 to F3; G: Two transcription factor gene clusters showing sequential decreases in expression; H: Insulin/Wnt signaling gene cluster showing decreased expression from F2 to F3; I: A gene cluster showing a peak or bottom at F3.

