
Figure 1.
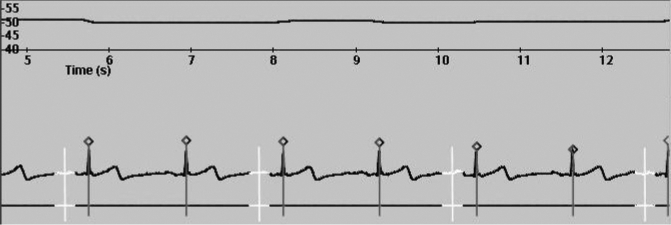
Principle of prospectively triggered step-and-shoot cardiac CT. Top: Heart rate trend graph; Bottom: Patient ECG during step-and-shoot CT angiography acquisition. White segments denote the time periods with X-ray tube on. White vertical line: 75% of the R-R-Interval. Vertical lines with diamonds: ECG triggering points.