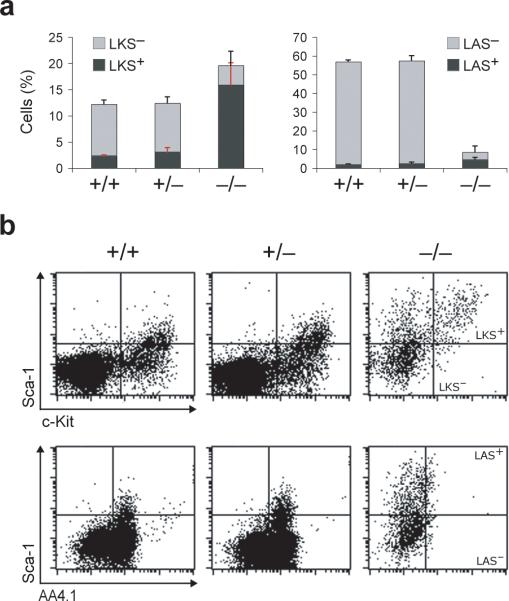
Fig. 1. ADAR1 is dispensable for the emergence of phenotypic HSCs and MPPs in the fetal liver.
(a) Graphs represent the frequencies of live, lineage depleted (Lin−) cells from E11.25 FL analyzed for c-Kit and Sca-1 (LKS) or AA4.1 and Sca-1 (LAS) expression LKS+ and LAS+ HSCs (dark grey bars), and LKS− and LAS− progenitors (light grey bars). Data are expressed as mean ± s.d. (3−5 tissues for each genotype). Statistical significance was determined by unpaired t test with p-values ranging from <0.0001 to 0.0328 (p<0.05 is considered statistically significant by this test). (b) Representative flow cytometry profiles of live Lin− c-Kit+ Sca-1+ (LKS+), Lin− c-Kit+ Sca-1− (LKS−), Lin− AA4.1+ Sca-1+ (LAS+), and Lin− AA4.1+ Sca-1− (LAS−).

