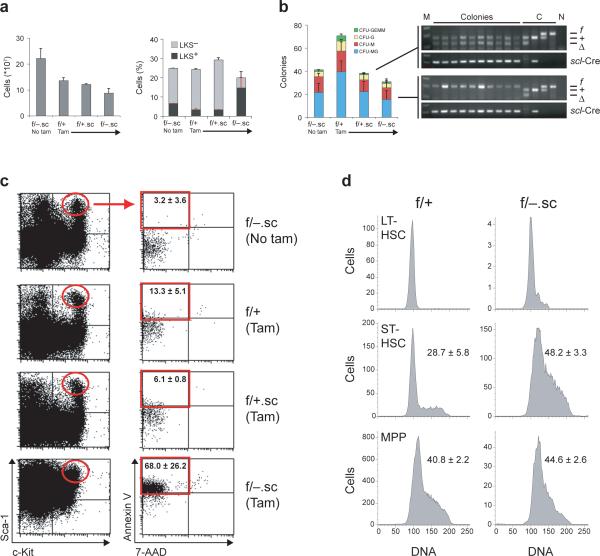
Fig. 3. Induced deletion of ADAR1 in HSCs of adult mice leads to hyperproliferation and apoptosis.
(a) Absolute numbers of total bone marrow cells (grey bars), and frequencies of HSCs (LKS+) and progenitors (LKS−) in induced (Tam) and uninduced (No tam) adult mice. (b) Numbers of methylcellulose colonies grown from 12,500 bone-marrow cells of induced (Tam) and uninduced (No tam) Adar.sc mice, and representative Adar allele and scl-Cre transgene specific genomic PCR analysis of individual colonies from Adarf/+.sc (upper panel) and Adarf/−.sc (lower panel) bone marrow. DNA size markers (M) and no-template controls (N) are indicated. (c) Representative flow cytometry profiles of bone-marrow LKS+ HSCs (red ellipse) analyzed for apoptotic and necrotic cell death by Annexin V / 7-amino-actinomycin D (7-AAD) staining. Frequencies of apoptotic LKS+ HSCs (red frame): 3.2 ± 3.6 % (f/−, no tam); 13.3 ± 5.1 % (f/+, tam); 6.1 ± 0.8 % (f/+.sc, tam); 68.0 ± 26.2 % (f/− .sc, tam). (d) Representative cell cycle analysis of LKS+CD34lo long-term (LT-) HSCs, LKS+CD34hi short-term (ST-) HSCs, and LKS− multipotent progenitors (MPP). Numbers represent the frequency of cells in S-phase. All data presented in (a-d) are expressed as mean ± s.d. (3 mice per experimental group and 2 mice in each control group).

