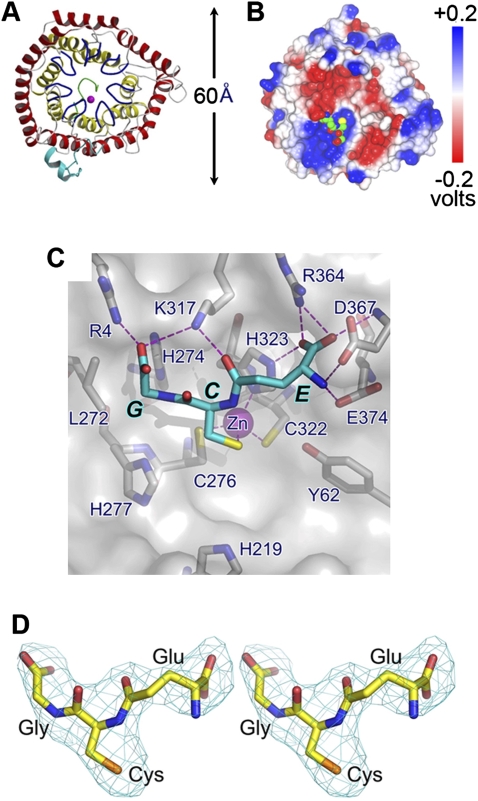
Figure 1.
Overall structure of LanCL1. (A) Ribbon representation of human LanCL1. The outer helix barrel is depicted in red and the inner helix barrel is shown in yellow. The seven GxxG-containing bulges are colored blue. N-terminal and C-terminal regions are colored cyan and green, respectively. The Zn2+ ion is depicted with a magenta sphere. (B) Electrostatic potential distribution of LanCL1. Electrostatic potential is mapped on the molecular surface. Bound GSH is shown in a space-filling model, with carbon, nitrogen, oxygen, and sulfur atoms colored in green, blue, red, and yellow respectively. The orientation of the molecule is similar to that seen in A. (C) Crystal structure. GSH is shown by a cyan stick model, and LanCL1 is shown in a molecular surface model superimposed with selected residues depicted by gray stick models. Zn2+ ion is shown as a magenta sphere. Oxygen, nitrogen, and sulfur atoms are colored red, blue, and yellow, respectively. Hydrogen bonds (or salt bridges) are shown as dashed magenta lines. Amino acid residues surrounding and those of GSH are labeled as single letters. (D) Stereo view of the electron density of the bound GSH molecule. The 2.8 Å Fo–Fc electron density map was phased with the final refined model, omitting GSH followed by a few cycles of refinement to reduce bias. It is contoured at three standard deviations and overlapped with the stick model of GSH.

