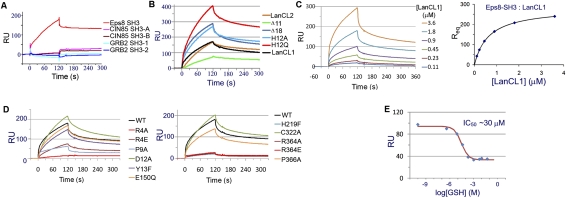
Figure 3.
LanCL1 interaction with Eps8 SH3 as determined by SPR. (A) Interaction between a number of SH3 domains and immobilized LanCL1. Only the Eps8 SH3 domain showed significant binding. (B) Interaction between LanCL2 variants and immobilized Eps8 SH3. Wild-type (WT) LanCL1 was included as a reference. Disrupting the N terminus of LanCL2 appears to improve its binding with the Eps8 SH3 domain. Binding was performed using 1.0 μM analyte and repeated multiple times. Representative sensorgram curves are shown. (C) Eps8 SH3 interaction with wild-type LanCL1. GST-Eps8 SH3 fusion protein was immobilized on the sensor chip (∼2000 response units [RU]). LanCL1 was introduced at concentrations ranging from 0.11 to 3.6 μM. Representative sensorgram curves are shown in the left panel. Equilibrium SPR signal (Req) calculated at each concentration is plotted on right. (D) Comparison of LanCL1 variants binding to immobilized GST-Eps8 SH3. Mutations in the N-terminal and C-terminal halves are divided into two panels for clarity. Wild-type LanCL1 binding is shown in both panels by a black line. Binding was performed using 1.8 μM analyte. (E) Inhibitory effects of GSH on LanCL1–SH3 binding. LanCL1 (5 μM) was bound to immobilized Eps8 SH3 domain in the presence of GSH of various concentrations (0–50 mM). RU signals of the LanCL1–SH3 binding at the beginning of the dissociation period were recorded (diamonds), and the red line is the fitting curve to a competitive inhibition model.

