Figure 1.
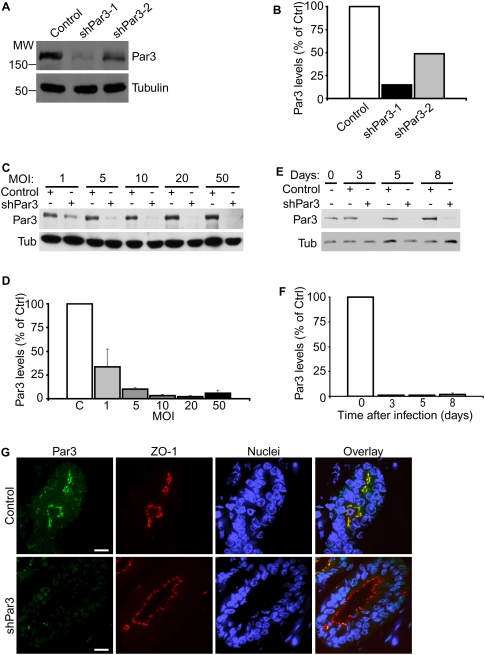
Knockdown of Par3 in primary mouse mammary epithelial and stem cells. (A) NIH 3T3 cells were transduced with two different shRNA lentiviruses against mouse Par3. Par3 and tubulin levels were assayed by immunoblot 7 d after transduction. (B) Quantification of Par3 knockdown in A. Data represent means from two independent experiments. Tubulin was used as an internal control. (C) Primary mouse MECs were transduced with control or shPar3 lentivirus at MOIs equal to 1, 5, 10, 20, or 50. Par3 and tubulin protein levels were assayed by immunoblot 10 d after lentiviral transduction. (D) Quantification of Par3 knockdown in C. Data represent means from two independent experiments. Tubulin was used as an internal control. Error bars, SD. (E) Time course for lentiviral knockdown of Par3 in primary mouse MECs. Cells were transduced at a MOI = 20 with shPar3-1 lentivirus. Par3 protein levels were assayed by immunoblot at the indicated times after lentiviral transduction. (F) Quantification of Par3 knockdown in E. Points represent means from two independent experiments. Tubulin was used as an internal control. Error bars, SD. (G) Paraffin sections of control and shPar3 mammary glands 8 wk after transplantation. Sections were immunostained for Par3 and ZO1. Bars, 20 μm.

