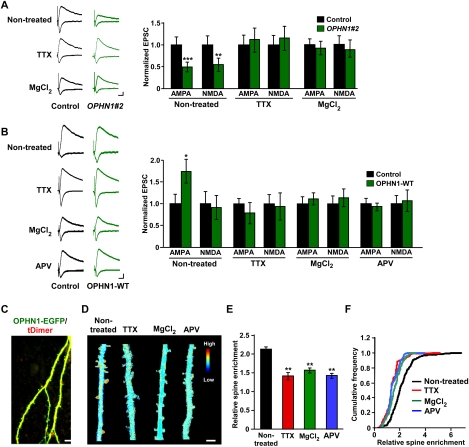
Figure 3.
Spontaneous neuronal activity is important for OPHN1’s synaptic function and localization. (A, left panel) Representative traces of EPSCs recorded simultaneously from a pair of uninfected neurons (control) and OPHN1#2 shRNA-expressing neurons under the indicated conditions. (Right panel) Quantification of the EPSCs mediated by both AMPAR and NMDAR for each experimental condition as indicated (untreated: n = 12 pairs; TTX: n = 10 pairs; MgCl2: n = 11 pairs). Data are shown as mean ± SEM. (**) P < 0.01; (***) P < 0.005, by paired Student's t-test. (B, left panel) Representative traces of EPSCs recorded simultaneously from a pair of uninfected neurons (control) and OPHN1-WT-expressing neurons under the indicated conditions. (Right panel) Quantification of the EPSCs mediated by both AMPAR and NMDAR for each experimental condition as indicated (untreated: n = 12 pairs; TTX-treated: n = 12 pairs; MgCl2-treated: n = 10 pairs; APV-treated: n = 9 pairs). Data are shown as mean ± SEM. (*) P < 0.05 by paired Student's t-test. (C) Representative images of dendritic branches of a hippocampal CA1 pyramidal neuron cotransfected with OPHN1-EGFP (green) and tDimer (red) maintained in normal media acquired with TPLSM. Bar, 10 μm. (D) Ratio images of cells expressing OPHN1-EGFP and tDimer are shown under the indicated conditions. Blue depicts low OPHN1 density, and red depicts high density. Bar, 5 μm. (E) Quantification of enrichment of OPHN1-EGFP in spines for each experimental condition as indicated (untreated: n = 7 cells; TTX-treated: n = 8 cells; MgCl2-treated: n = 7 cells; APV-treated: n = 6 cells). (F) Cumulative distributions of enrichment of OPHN1-EGFP in spines from the data plotted in E. Data are shown as mean ± SEM. (**) P < 0.01 by the Kolmogorov-Smirnov test.

