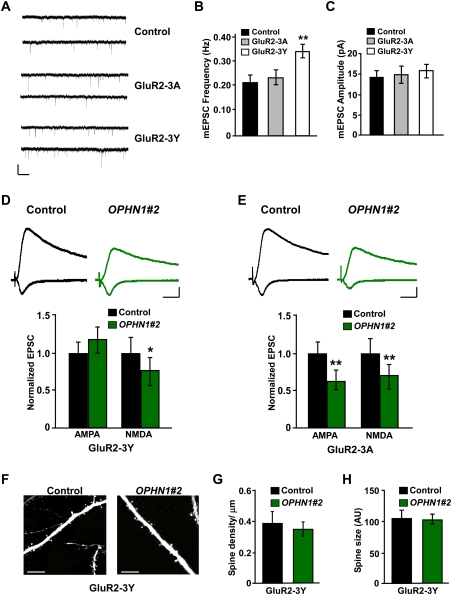
Figure 7.
OPHN1 regulates synaptic function and structure by stabilizing AMPA receptors. (A) Representative traces of excitatory miniature events recorded at −60 mV from untreated neurons (control) and neurons treated for 4 d with GluR2-3A or GluR2-3Y. Bars, 5 sec and 20 pA. (B,C) Quantification of mEPSC frequency (B) and amplitude (C) for control, GluR2-3A-treated, and GluR2-3Y-treated neurons (control: n = 17 cells; GluR2-3A: n = 16 cells; GluR2-3Y: n = 22 cells). (**) P < 0.01 by Student's t-test. (D,E, top panels) Representative traces of EPSCs recorded simultaneously from a pair of uninfected neurons (control) and OPHN1#2 shRNA-expressing neurons treated with GluR2-3Y peptide (D) or GluR2-3A peptide (E). Bars, 20 msec and 20 pA. (Bottom panel) Quantification of the EPSCs mediated by both AMPAR and NMDAR from pairs of neurons treated with GluR2-3Y or GluR2-3A peptide. (D) GluR2-3Y: n = 15 pairs. (E) GluR2-3A: n = 9 pairs. (F) Representative TPLSM images of secondary apical dendrites from CA1 pyramidal neurons expressing EGFP only (control) or OPHN1#2 shRNA and EGFP (OPHN1#2) treated with GluR2-3Y peptide. Bar, 10 μm. (G,H) Quantification of spine density (G) and spine size (H) for control and OPHN1#2 shRNA-expressing neurons treated with GluR2-3Y peptide (n = 4 cells for both groups). Data are shown as mean ± SEM. (*) P < 0.05; (**) P < 0.01 by paired Student's t-test.

