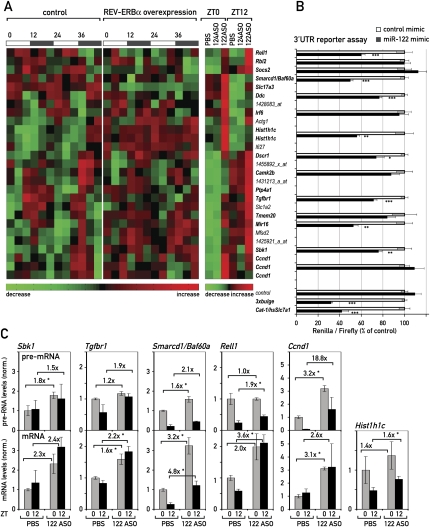
Figure 4.
Circadian genes are miR-122 targets. (A) Heat map of the circadian probe sets (left and middle panel; taken from Kornmann et al. 2007b) that are up-regulated in 122ASO mice (right panel). Smarcd1/Baf60a was just below the stringent criteria used for circadian expression in the microarray data of Kornmann et al. (2007b), but was also included in the figure as it was confirmed as robustly circadian by qPCR (see Fig. 5). Heat scales at the bottom of the panels represent changes on a linear scale with green and red representing minimal and maximal expression, respectively. Transcripts in bold type contain potential miR-122 seed sites in their 3′UTRs. (B) The effect of miR-122 mimics in a 3′UTR luciferase assay. Control has only the vector 3′UTR, containing no seed sites. 3xbulge and Cat-1/hsSlc7a1 are positive controls for 3′UTRs known to be regulated by miR-122. Values are mean ± SEM (n ≥ 6 per transfection). (*) P < 10−2; (**) P < 10−3; (***) P < 10−4 (two-tailed Student's t-test). (C) qPCR analysis in 122ASO mice and PBS controls of pre-mRNA (top panels) and mRNA (bottom panels) levels of selected transcripts from A. Hist1h1c is an intron-less gene; hence, pre-mRNA levels were not measured. Note that Ccnd1 is also changed on the pre-mRNA level and is hence probably up-regulated by an indirect, transcriptional effect. Data are mean values of three mice per condition ±SEM. (*) P < 10−2 (two-tailed Student's t-test).

