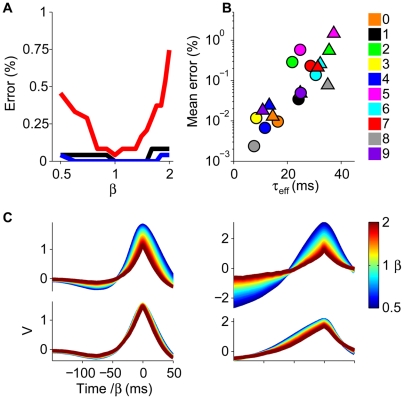
Figure 8. Time-warp robustness.
(A) Error versus time-warp factor β. (B) Mean errors over the range of β shown in (A) (digit color code; triangles: female speakers, circles: male speakers) versus the mean effective time constant τ eff calculated for β = 1 by averaging the total synaptic conductance over 100-ms time windows prior to either the output spikes (target stimuli) or the voltage maxima (null stimuli). (C) Mean voltage traces for time-warped target patterns for the neurons shown in Figure 7. Bottom row: conductance-based neurons, upper row: current-based neurons (see Materials and Methods).

