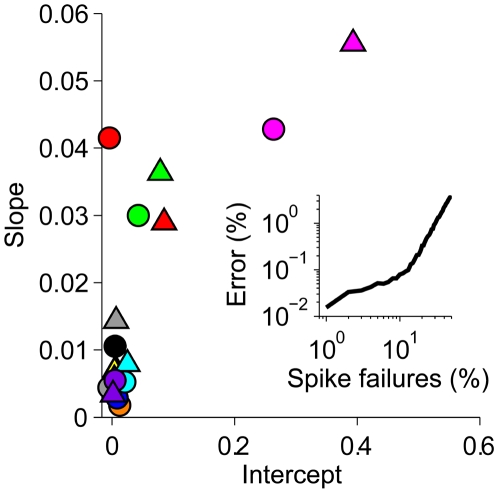
Figure 9. Robustness to spike failures.
The error fraction of each digit detector neuron was measured as a function of the spike failure probability over the range from 0% to 10% and fitted by linear regression. For each neuron, the resulting slope (median 0.0069) is plotted versus the intercept (median 0.0061) with symbols and colors as in Figure 8B. The median R 2 of the linear regression fits was 0.94. The inset shows the median error fraction of the population as a function of the spike failure probability in the range of 1% to 50% with the robust regime braking down at approximately 20%.

