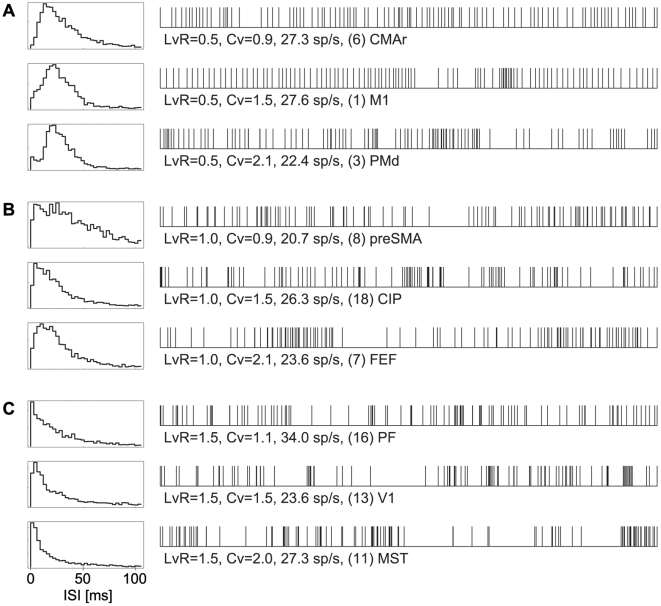
Figure 6. ISI distributions and sample firing patterns.
(A), (B) and (C): Left: Distributions of 2,000 interspike intervals (ISIs) from neurons that exhibited LvR = 0.5, 1.0, and 1.5, respectively. For LvR values, three neurons are sampled that exhibited different Cv values close to 1.0, 1.5, and 2.0. Right: Sample firing patterns consisting of 100 consecutive ISIs for each.

