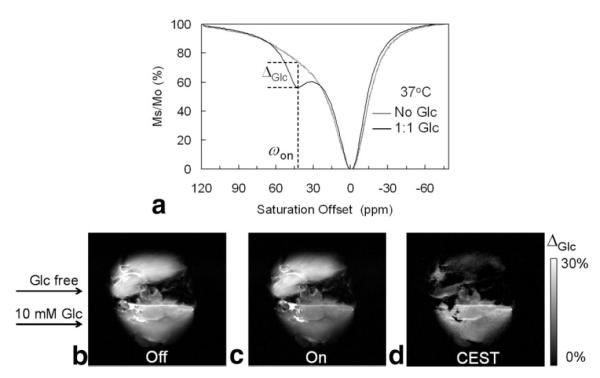
FIG. 5.
a: Z-spectra of fresh effluent from a perfused fed-mouse liver and a 24-hr fasted mouse liver at 37°C showing a glucose-induced CEST peak at ωon = 42 ppm. Both perfusates contained 10 mM EuDOTAM-2M-2PB agent, pH = 7.4. b,c: CEST images of a fed mouse liver (bottom) and a 24-hr fasted mouse liver (top) perfused with 10 mM EuDOTAM-2M-2PB agent in the presence (fed liver) and absence (fasted liver) of 10 mM glucose, 37°C. The “off-resonance” image (b) showed no contrast between the two livers while the “on-res-onance” image (c) showed image darkening of fed liver versus the fasted mouse liver with ωon = 42 ppm. d: The CEST image showed the glucose-induced CEST contrast between the fed and fasted mouse livers.

