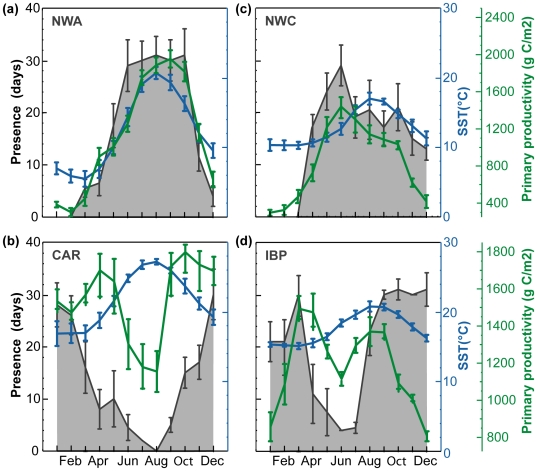
Figure 6. Mean (±SD) monthly number of days that bluefin tuna were present (1996–2005) within high use areas (grey shaded) in relation to mean (±SD) monthly level of primary productivity (green line) and sea surface temperature (blue line).
(a) Nortwest Atlantic (n = 32) (b) Nortwestern Corner (n = 5) (c) Carolina (n = 52) (d) Iberian Peninsula (n = 4).

