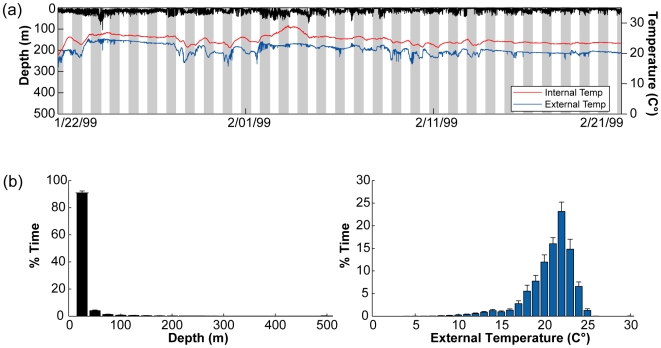
Figure 7. Typical diving behavior, external and internal temperature in the high use area of North Carolina.
(a) One month of a typical diving behavior (black) profile displayed with external (blue) and internal temperature (red) (WC98-485). Grey shades indicate nighttimes obtained through light level data. (b) Overall depth (left,black histogram) and ambient temperature (right, blue histogram) preferences in the high use area of North Carolina (1997–2005; n = 50).

